Bookkeeping is a continuous process of recording all kinds of financial related transactions of a company based on standard methods. It is mainly about recording, organizing, and classifying all financial transactions of an organization. This is useful for a business in order to manage expenses, to make cash flow decisions and to overall run the business more responsibly.
Bookkeeping which is the basis of accounting and the process of making financial statements is an important activity for businesses of all different scales and sizes. It helps business owners to assess financial health of a business in order to make prudent decisions. Accounting information play an integral part of overall companies Management Information Systems (MIS).
Table of Contents
What is Google Sheets?
Let’s first understand the program we use for this bookkeeping exercise before diving in to the world of accounting theory. Google sheets is a spreadsheet program similar to Microsoft Excel. It’s part of a suite of FREE online applications made by Google. You may be familiar with other applications in this suite like Google Docs, Google Drawings, Google Slides, Google Keep, and Google Sites. Google sheets can convert data into charts, formulas, graphs, and tables similar to Microsoft Excel. For small businesses this application is perfect because it has all the required functions and it’s totally free to use.
20 Google Sheets Tips That Will Save You Time and Headaches
Google Sheets for small business bookkeeping
You can use Google sheets for bookkeeping, and to prepare basic financial statements. By recording financial transactions this way business people like you can use these information for decision making.
You need to have a Google account to use Google sheets. Google sheets is a user friendly spreadsheet program that has very similar user interface to MS Excel. Google sheets can be used for variety of accounting and finance related purposes such as for preparing day-to-day income statements, cash flows, budgets, dealing with foreign transactions, manage bank accounts, calculating tax and ratios.
Template Gallery
Personal Templates
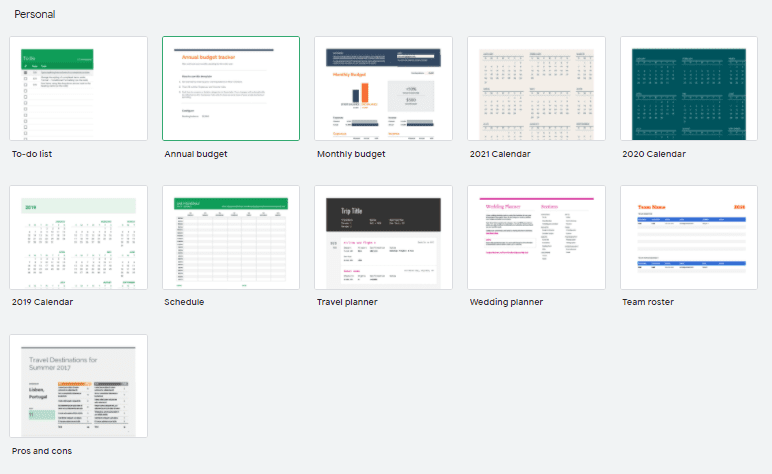
Google sheets provide a template gallery for different uses. These templates are mainly classified into two categories: Personal templates and Work templates. Personal templates category include templates like: to-do list, annual budget, monthly budget, calendar, schedule, travel planner, wedding planner, team roster, and pros and cons. These are suitable to record personal details.
Work Templates
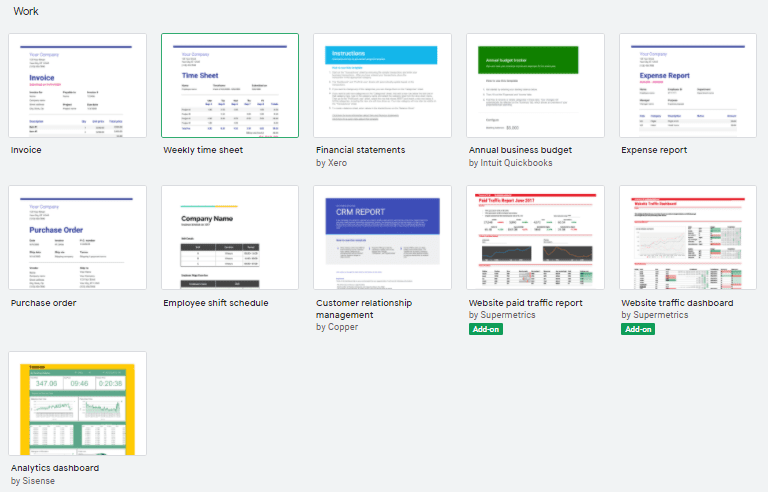
On the other hand, people who are engage in some kind of business activity can use work templates that provide formats for: invoices, weekly timesheet, financial statements, annual business budget, expense report, purchase order, employee shift schedule, customer relationship management, web site paid traffic report and analytical dashboard.
All these templates are user friendly and easy to use. You can use them to record various kind of data and later analyse them for decision making.
Bookkeeping
Now let’s dive into our main subject of this article. Bookkeeping is all about recording financial transactions such as purchases, sales, receipts, and payments of a business according to a particular standard. Double-entry method is the standard bookkeeping method that’s used by many to record business transactions. The way it works is, it records credit and debit entries that occur due to a particular transaction (money goes out, an asset comes in) so the sum of a particular transaction is always 0. Accounting Equation which also known as the balance sheet equation states that sum of the owner’s capital and company’s total liabilities is equal to the company’s total assets at a particular point of time.
A
=
L + E
Assets + Expenses
=
Liability + Equity + Revenue
Debit
Credit
According to the standards, debit accounts are represented by assets and expenses accounts while credit accounts are represented by liability, equity, and revenue accounts. Therefore, increase the assets or expenses means that will be impacted to increase the debit account balances and decrease the credit balances. On the other hand, increase the equity or revenue will be impacted to increase the credit balances and decrease the debit account balances.
Assets & Expenses
* Increase in asset value > (Results in) Increase in the debit balance > (Then) Debit the transaction value
* Decrease in asset value > Decrease in the debit balance > Credit the transaction value
* Increase in expense value > Increase in the debit balance > Debit the transaction value
* Decrease in expense value > Decrease in the debit balance > Credit the transaction value
Equity, Liability & Revenue
* Increase in equity value > (Results in) Increase in the credit balance > (Then) Credit the transaction value
* Decrease in equity value > Decrease in the credit balance > Debit the transaction value
* Increase in liability value > Increase in the credit balance > Credit the transaction value
* Decrease in liability value > Decrease in the credit balance > Debit the transaction value
* Increase in revenue value > Increase in the credit balance > Credit the transaction value
* Decrease in revenue value > Decrease in the credit balance > Debit the transaction value
Journal entries
This is the primary base of recording all financial transactions of a company. Below guidelines will come handy to you when recording journal entries with Google sheets.
- Go to Google sheets, and make a blank sheet.
- Go to the top of the Google sheets and rename the “Untitled spreadsheet” into “Journal entries” by typing on that blank space. It’s automatically saved to your Google Drive now.
- Type your company name in the first cell (Eg: 1A) and merge cells at the top.
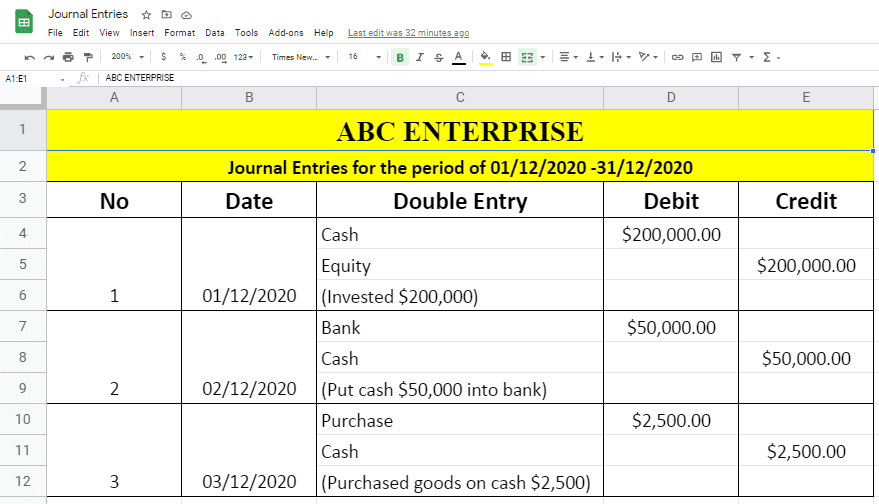
- Add column headings to the top of journal entry table as: No, Date, Double Entry, Debit, and Credit.
- Fill in the transaction details under each heading like: I Invested $200,000 to the business. In this case, put “1” under No heading, put “01/12/2020” under Date, put “Cash” under Double Entry column and put ‘’$200,000” under Debit column (Debit entry).
- Go to the below row and type “Equity” under the “Journal entry” column and put “$200,000” under the credit column (Credit entry).
- I Invested $200,000 to the business means it affected to increase the money available to business from $200,000 therefore, we debit the cash by $200,000 since cash is an asset. On the other hand, that transaction impacted to increase my equity position in the business (business owes this money to pay me back someday) so we credit the equity account by $200,000. So now the double entry of this transaction is complete and when you tally/sum the debit and credit records the result is 0. This means accounting equation is tallied.
- You can style the table by adding it a border. Go to “borders” and click “all borders”.
Primary Books and T accounts
These accounts or books are the first steps of recording the financial transactions of a person or an organization according to basic accounting concepts and standards.
- The opening balance of the assets is recorded on the debit side meant left side of the T accounts and the opening balance of liabilities and equities are recorded on the credit side meant the right side of the T accounts.
- The main details that should be represented in primary accounts are date, description, debit, and credit amount. Put those in each column of Google sheet and use “borders” and select the entire required space to create the table.
- According to the above double entries, invest $200,000 means increase cash and at the same time increase the equity of the company. It is represented in double entries as $200,000 debit to cash and $200,000 credit to equity.
- In our primary and T accounts, users can represent it by entering $200,000 into the debit side of the cash account and entering the same value into the credit side of the equity account. Put the relevant date and description in both T accounts.
- Purchase goods at $2,500 mean that transaction impacts increase the purchases. Therefore we need to debit the purchase account and credit the cash account by $2,500 because this transaction decreases the cash balance.
How to do Simple Financial Calculations with Google Sheets Formulas
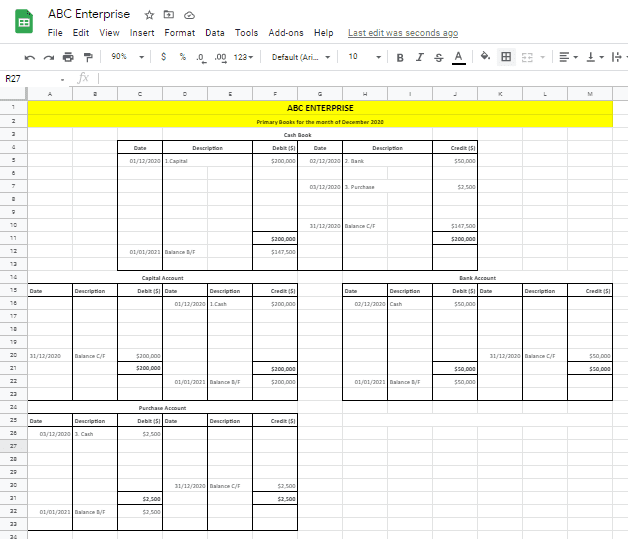
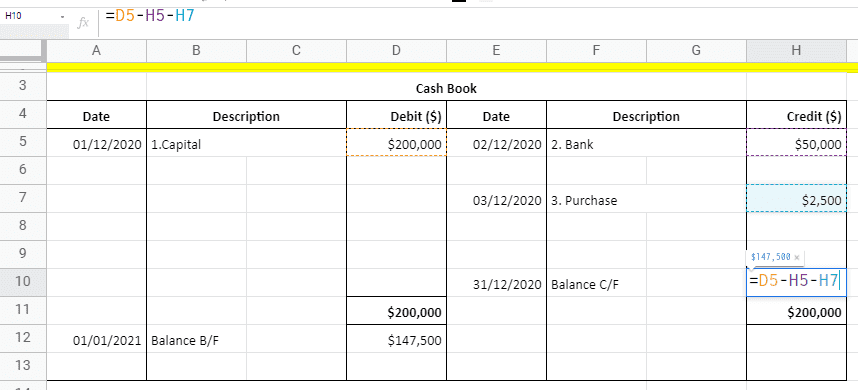
- Carry forward value of each account means remain balance forward to next financial period after doing all related transactions correctly. When looking at the cash book of ABC Enterprise, the final balance of December month is different from the opening balance due to some transactions that occurred during the month.
- Therefore we can get the final carry forward balance for next month by adjusting transactions during the period with the opening balance of cash account available at beginning of the December month.
- This can be easily calculated by using the formula available in Google sheet.
- According to the below image, the final balance of the cash book should be calculated by adding a debit balance and reducing the credit balance from the opening balance of the cash book.
- Final Balance = Opening balance – (Bank + Purchase)
- =D5-H5-H7
- Go to the final balance value (Balance C/F) cell and put an equal mark (=) and select the opening balance value cell ($200,000). Then put a minus mark (-) and select all credit values ($50,000+$2500). After that hit enter button to get the answer.
Total Sales Summary
This summary is helpful to calculate the cost of sales and gross profit of a business. This is important to manage revenues and costs associated with a venture and to forecast its future earnings.
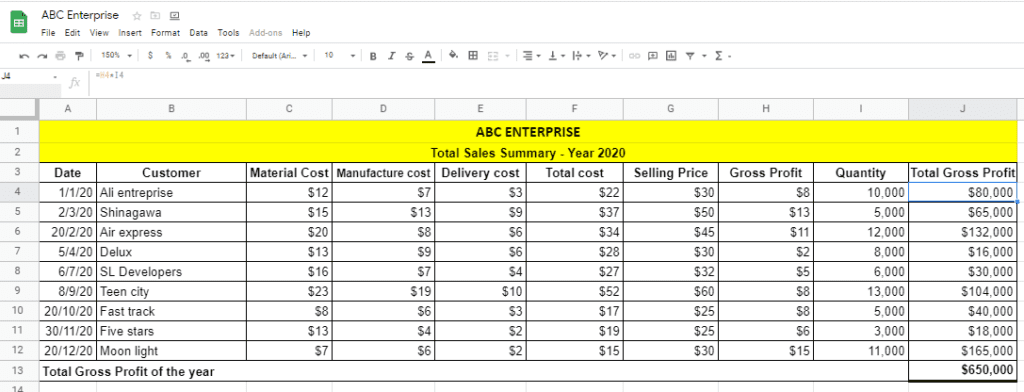
- Identify the most relevant details that should be included in the summary. Mainly the date, customers, costs such as material cost, manufacturing cost, delivery cost, selling price, sales quantity, and total gross profit columns.
- Put table headings like date and customer name at the top. Draw the table using borders feature. After that put associated costs and selling price for each customer.
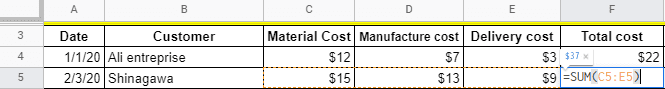
Total cost means the total value of material cost, manufacturing cost, and delivery cost. Therefore the total cost value can be calculated by using the below formula.
- Total cost = Material Cost + Manufacturing cost + Delivery Cost
- = SUM (C5:E5)
- This total cost value can be easily calculated by using the “SUM” function.
- Select the relevant cell in the total cost column (F5) and put an equal sign (=). After that type “SUM” or choose the “SUM” through the “functions” tool. Then select the three types of cost values (Shinagawa = $15+$13+$9) range (C5:E5), close the brackets and hit enter.
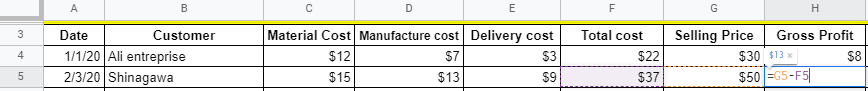
Gross profit is the remaining value after deducting total cost of sales from sales value of a particular customer.
- Gross Profit = Sales – Cost of Sale
- =G5 – F5
- Go to a customer gross profit cell (H5). Then put the equal mark (=) and select selling price (G5). Then put minus sign (-) and choose the total cost value cell (F5) and click enter.

Total gross profit can be calculated by multiplying the gross profit per unit by the quantity sold.
- Total gross profit = Gross profit per unit * Quantity sold
- =H5*I5
- Go to a customer total gross profit cell (J5). Put the equal sign (=), select the gross profit per unit cell (H4) and multiply with the quantity (I5) and click the enter button.
According to above method, find total cost, gross profit for each customer and then you can calculate total gross profit for the year by using the “SUM” function.
- Total gross profit for the year = Gross profit total of each customer
- =SUM (J4 : J12)
Expense Summary
Expenses summary is a simple summation of business expense data. It is helpful to analyze monthly & annual total expenses and forecast future cash requirements. This statement can come handy when devising a business expense policy.
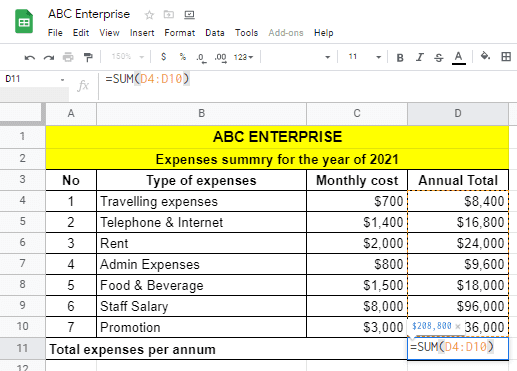
- Create the table with all necessary headings such as Types of expenses, monthly cost, and total annual cost.
- Select required number of columns and rows and choose the suitable border to create the table.
- Enter types of expenses such as traveling, rent, staff, etc. Put associated monthly cost of each expense under the title “Monthly cost”.

To calculate the annual total of traveling expense, go to the relevant cell (D4) under the “Annual cost” column and put an equal mark (=), then select the monthly cost value of traveling expense ($700) and multiply it by 12 to get annual value.
- Annual Total = Monthly Total * 12
- C4*12
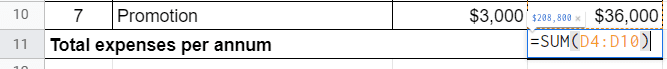
Total expenses per annum is the sum of each expense. This can be easily calculated using the formula available in Google sheet.
- Select the right cell (D11) and put an equal mark (=), then type “sum” or select the “sum” by using the “functions” tool.
- After that, select the data range that you want to get the total value and hit enter.
- So the formula is =SUM (D4: D10).
Income Statement
Income statement is a consolidated summary of income and expense up to a particular date. Here we calculate business profitability.
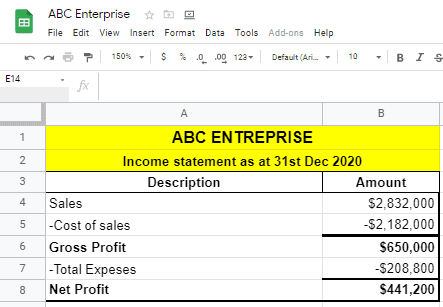
The difference between Net Profit and Gross Profit is that it deduct other types of expenses which are not considered in the cost of sales. Gross profit can be interpreted as the direct profit line generated by selling merchandise.
Google sheets provide a feature to link cells between two different sheets. This feature is useful when preparing income statement. This way we can fetch a value to a cell that has already been calculated in another sheet. One use case of this method is to link values in cells where we have used formula for calculation. We can create complete automated system that updates with new data. Here we have brought cost of sales number (Total Cost * Total Quantity) to our income statement table from the sales summary sheet. When the reference table cell gets updated this figure here gets auto updated too.
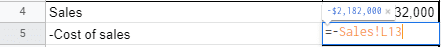
- Type the equal sign in the calculation cell (B4) and go to the sales summary sheet and select the cell that shows total cost of sales (L13). Then hit the enter button.
- =Sales! L13
We already calculated Total expense value in the expense summary sheet. Therefore we can link that cell to the income statement without manually typing it.
- Select the total expenses cell (B7) in the income statement.
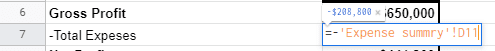
- Put equal sign (=), go to expense summary sheet and select the total expenses value cell (D11). Link this cell to the cell in income statement.
- = Expense summary !D11
Using Accounting Data to Calculate Ratios
Ratios are calculated to measure things like liquidity, profitability, and operational efficiency. These are calculated using the data that is on financial statements we made. These ratios can be easily calculated using Google sheets.
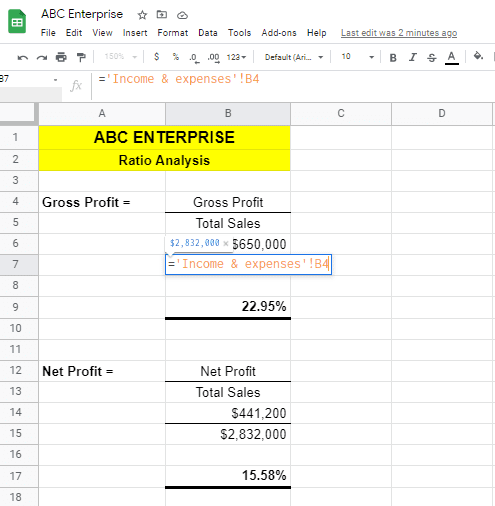
We can calculate many types of ratios using financial statement data. These ratios play an important part in business decision making process. The linking feature we discussed is very useful for ratio calculations. The gross profit ratio equal to gross profit as a proportion of total sales value. Gross profit ratio is calculated by dividing gross profit from the total sales amount. Gross profit and total sales value already available in the income statement sheet. Therefore we can link those values from the income statement.
- We need to bring forward gross profit, total sales, or net profit values from other statements we made.
- EX: Choose the cell (B6) and put equal sign (=), then go to the income & expenses sheet and select the gross profit value. Hit enter key to link this gross profit cell to gross profit margin calculation cell. Like wise for the denominator, go to income statement and select the total sales value cell and hit enter button.
- Calculate the ratio by dividing gross profit from total sales.
- The procedure is same in order to calculate the net profit ratio. The only thing we need to change is we link net profit cell to the numerator instead of gross profit.
and with that, we have come to the end of bookkeeping and basic accounting chapter of our series. You should now have basic understanding about accounting terms and how to utilize Google sheets to practically implement the theory. It’s a free tool that everyone should use to create different kinds of statements, ratios, formulas, and summaries.
All the Accounting statements we created in this article are available for you to refer in this link: Sample Basic Accounting Google Sheet Template.
PS: We recommend you to watch this YouTube playlist to learn more about this subject: LINK TO PLAYLIST.